
COLLEGE ON A CURVE
The familiar A through F grading system seems to have been invented at Mount Holyoke College in Massachusetts in 1884. By the 1940s, this system had been mapped to corresponding percentages and was the dominant form of grading used in most U.S. educational institutions. The scale was centered around 70% as an average level of acceptable performance, granting a letter grade of C. Anything below that was considered unsatisfactory, and anything above that was considered superior. Work that was in the top 10% of all students was deemed excellent, and awarded an A. This empirical gauge, originally conceived as a standard bell curve with most students in the middle, held true through the first half of the 20th century. But something changed around 1960.
An opinion piece in The Washington Post by a professor at Duke University led to a large research project on the subject of grade inflation. This study revealed that while Cs represented the majority of grades from 1900, in 1960 more As and Bs began to be awarded. By 1973, a shift had occurred, and the most popular grade was now a B. Beginning in 1998, there were officially more As given than any other grade, and that trend continues to this day. So what happened to our bell curve? What caused such a strange shift in American grading?
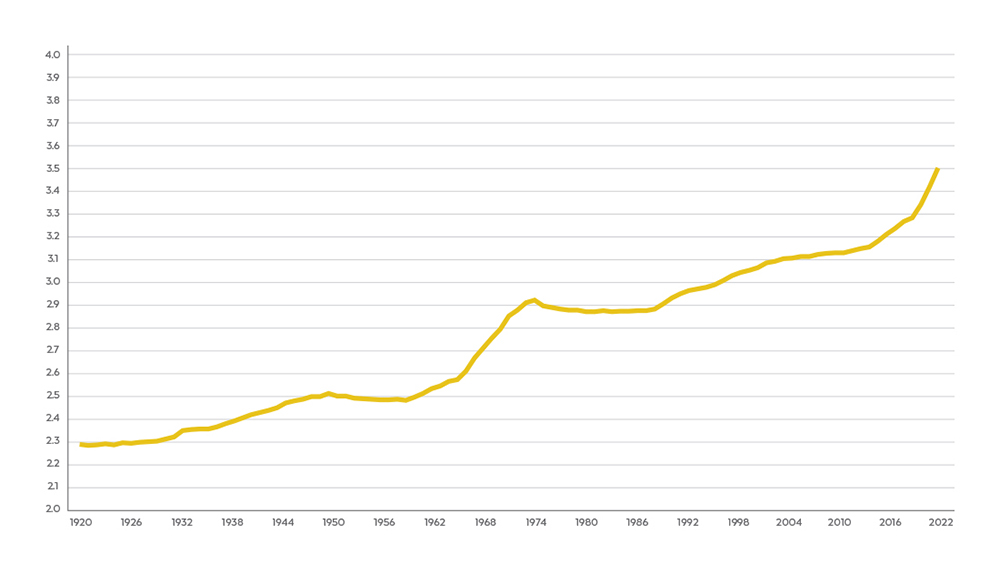
In 1920, the average GPA for college students in the United States was 2.30. That increased marginally for decades, but began climbing after 1960 due to a change in grading across most college campuses. The average GPA in 1960 was 2.51, but by 1974, that figure was 2.92, an increase of over 16% in just 14 years. The spike coincided with the Vietnam War, and many explanations center around the idea that college professors who were opposed to the war and concerned for their male students began awarding higher grades to keep their male students in school and out of draft status. There is no direct evidence for this theory, and it seems unreasonable that professors would compromise grading and education to make a political statement. A more fundamental argument against this would be that the Vietnam War draft was in effect from 1964-1975, but GPAs began rising four years before the draft and ceased rising before the end of the draft. So while there are two simultaneous events, rising GPAs and the Vietnam War, it's not so clear that they are related. And that first spike during the Vietnam War offers no explanation for why GPAs began increasing again in the 1990s. Maybe there's a better explanation.
AVERAGE COLLEGE GPA, 1920-2022
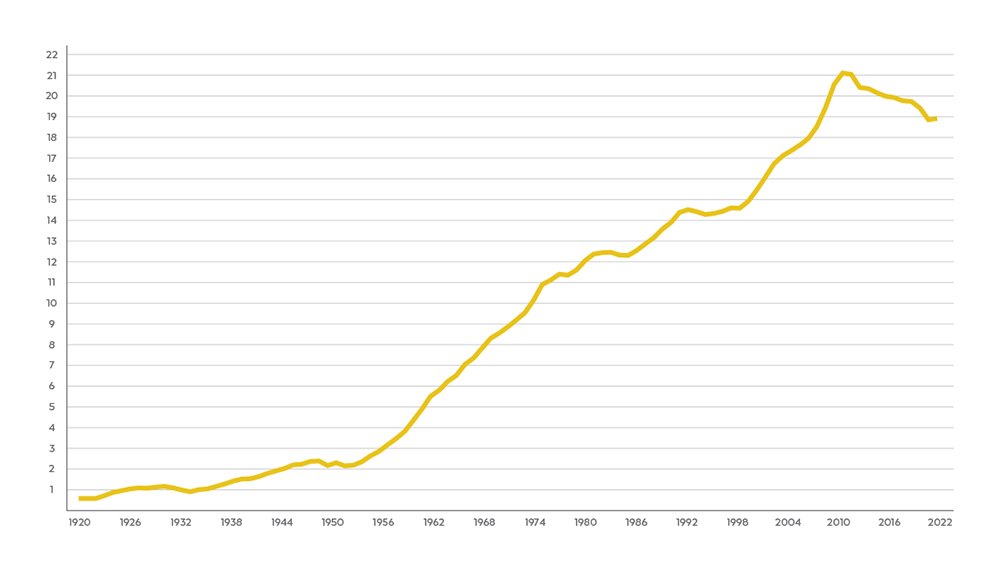
The Serviceman's Readjustment Act of 1944, otherwise known as the GI Bill, is frequently cited as the single most important catalyst for increasing college enrollment in the United States. The Department of Defense claims it exponentially grew college and vocational school attendance, and doubled university degrees between 1940 and 1950. When viewed in the light of the last 100 years, college enrollment in the United States remained fairly flat through the beginning of the 20th century, just like GPAs. Between 1920 and 1940, the number of university students grew from about 600,000 to about 1.5 million, which is an increase of over 150% over twenty years. That sounds impressive until you look at what began happening in 1951. Within ten years, college enrollment doubled to over 4 million. That rate of growth was maintained for 50 years, peaking in 2010 at just over 21 million. Over 60 years, U.S. college enrollment grew by over 1300%. The GI Bill was certainly an important factor, primarily for housing, but the 1950s saw one of the greatest booms to the U.S. economy, more than doubling the gross national product to over $500 billion. More people than ever had access to college, and the economy was moving in a direction where college degrees were becoming necessary for the best jobs.
AVERAGE COLLEGE ENROLLMENT, 1920-2022
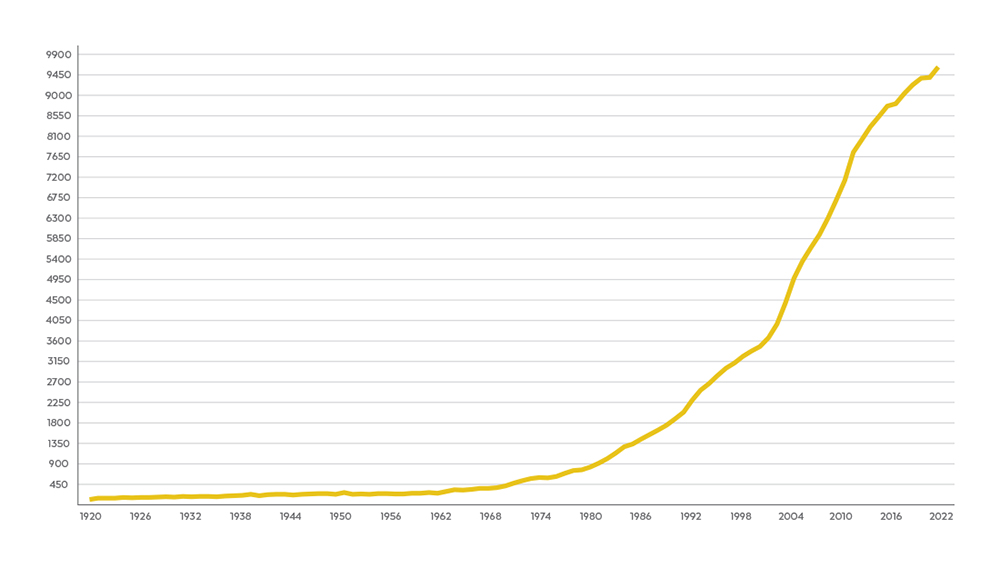
So it would seem college enrollment and GPAs grew together throughout the 20th century. But there's a third factor, and it's one that tends to get the most attention in the United States. In 1920, the average cost for one year of college tuition was $70. After 40 years, that figure had risen modestly to $189. But after 1960, tuition prices began doubling every ten years. In 1975, college tuition costs grew 5% over the rate of inflation, and continue to outpace inflation to this day. As of 2016, the United States pays at least twice the amount of most other developed countries for a college education.
AVERAGE COLLEGE TUITION, 1920-2022
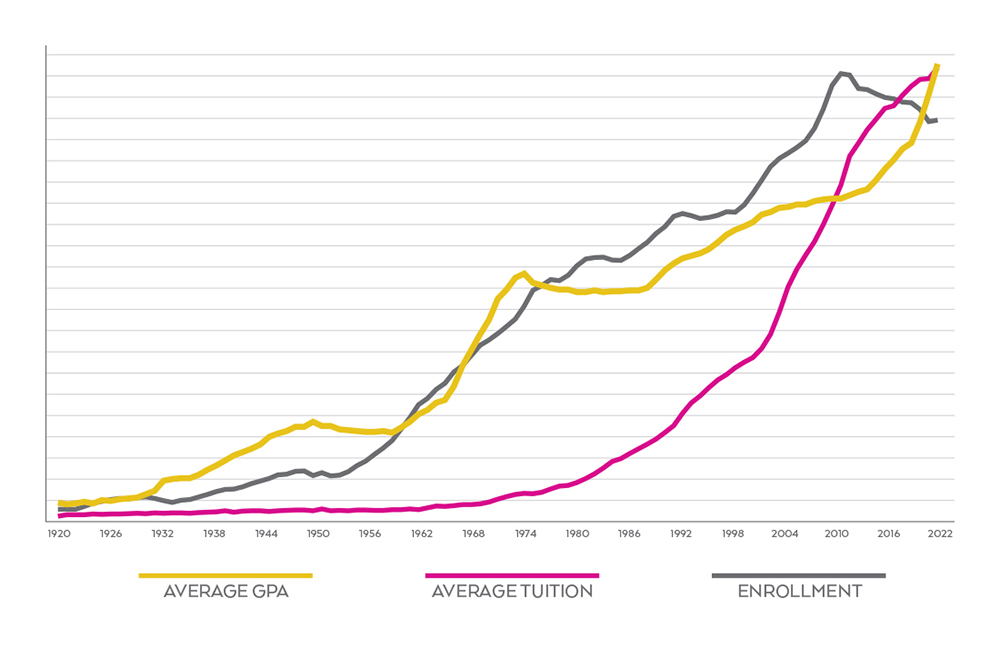
Placing all three graphs of these statistics atop one another becomes very revealing. All three remain fairly static for the first several decades of universities in the United States, all three begin increasing between 1950 and 1960, and all three increased to outrageously unpredictable levels. Adjusting beginning minimums and ending maximums to similar positions within the same timeframe yields eerily similar slopes. It would seem tuition costs, enrollment, and GPAs are interconnected and influenced by one another. College enrollment began its climb precisely in 1953, GPAs in 1959, and tuition costs in 1960. The most logical explanation for the relation of all the data is economics. Increased enrollment led to increased GPAs and tuition costs. Increased GPAs encouraged further enrollment and tuition costs. Increased costs justified increased enrollment and GPAs.
These statistics have bolstered a debate over the consumerization of American universities. Have students become consumers, should students be considered consumers, and what are the effects on our education systems if students are consumers? The largest perceived threat seems to be that degrees will lose their value if students are not entirely earning them and simply purchasing them, turning colleges into "degree mills." In 1920, 54,000 college degrees were conferred on 9% of all enrolled students. In 1960, when enrollment, tuition costs, and GPAs all began their inflated climbs, 477,000 degrees were conferred on 13% of all enrolled students. In 2010, when U.S. college enrollment reached its peak, 3.5 million degrees were granted to 17% of all enrolled students. And in 2022, 4.2 million degrees were given to 22% of all enrolled students.
These are the undeniable facts. College tuition costs and GPAs have become grossly inflated, proportionally following enrollment. In conjunction, colleges are awarding vastly more degrees. It is clear that all of this is being driven by economics, and students have absolutely become consumers. So in a world where average is now excellent, and qualifications are owed as a result of payment, have degrees lost their value? Since 2010, tuition costs and GPAs have continued to rise, but enrollment has fallen by 10%. It will be interesting to see how interconnected enrollment, tuition, and GPAs will remain over the next decade. As for the philosophical debates about the state of American universities, they can stop. Colleges have definitely changed and those changes have been influenced by economics. American universities have redefined not only our grading system, but our outlook and expectations on what constitutes excellence. And for all their bluster, on some level, colleges are absolutely selling degrees. Perhaps that's just a natural consequence of capitalism. Perhaps it's indicative of cultural shifts. Most likely, these are the repercussions for shifting the mean. It's one thing to optimistically believe in exceptionalism. It's quite another thing to redefine reality in order to create it.
SOURCES
- "Teaching More by Grading Less (or Differently)" from Life Sciences Education
- "Where All Grades Are Above Average" from The Washington Post
- "Grade Inflation at American Colleges and Universities" from GradeInflation.com
- "Grading in American Colleges and Universities" from Teachers College Record
- "75 Years of the GI Bill: How Transformative It’s Been" from U.S. Department of Defense
- "120 Years of American Education: A Statistical Portrait" from National Center for Education Statistics
- "College Enrollment & Student Demographic Statistics" from Education Data Initiative
- "Enrollment in educational institutions, 1869-2020" from National Center for Education Statistics
- "Total fall enrollment in degree-granting postsecondary institutions, 1947-2023" from National Center for Education Statistics
- "The 1950s" from History
- "Why Have College Tuition Costs Changed So Much in the U.S.?" from Work+Money
- "Average Cost of College by Year" from Education Data Initiative
- "America Spends More On College Than Virtually Any Other Country" from Forbes
- "Let’s Get Over Ourselves: Students are Customers, Now and Forever" from Modern Campus
- "Students Are Not Customers" from National Association of Scholars
- "Degrees conferred by degree-granting institutions, 1869-2022" from National Center for Education Statistics
LISTEN

SUBSCRIBE


